Introduction
When deciding on which IDE to use, one of the most important things is the debugging experience. In this short article I will try and share my experience debugging the same code with Visual Studio Code and RustRover
Coming from a Visual Studio background, I am used to a polished debugging experience, and spoiler alert: neither VS Code nor RustRover really disappoint me. Both seem to use the LLDB extension and that has some rough edges. And when it comes to RustRover, we must keep in mind that I am working on an Early Access release.
For this example I use my own code which can be found in this repository.
Visual Studio Code
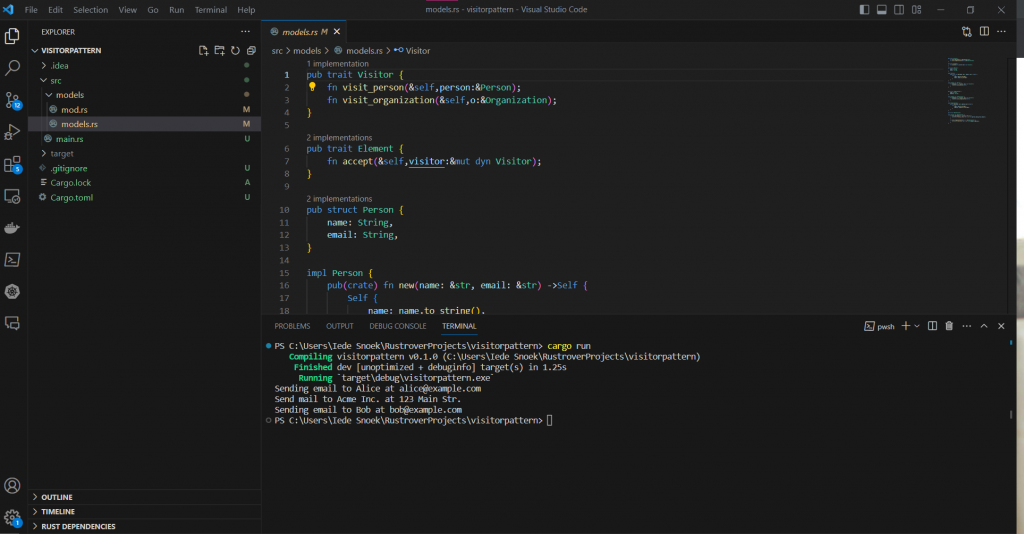
When you open visual studio code you see this, or something similar:
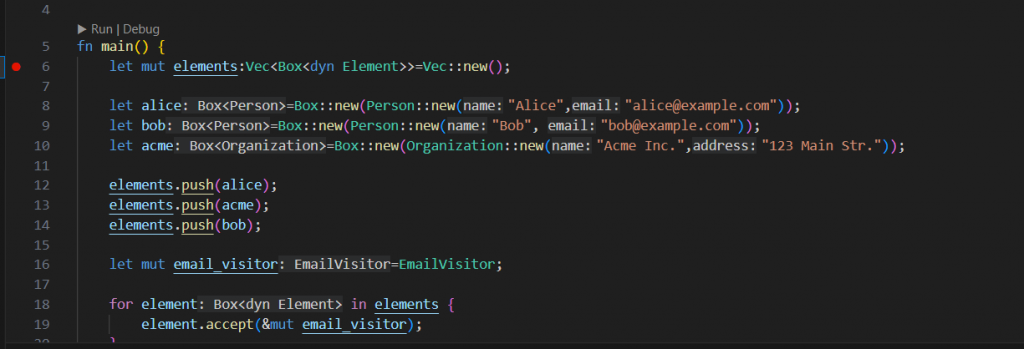
Now, in ‘main.rs’ (in the src directory), we can easily set a breakpoint by clicking in the left hand lane. It is indicated by the red dot:
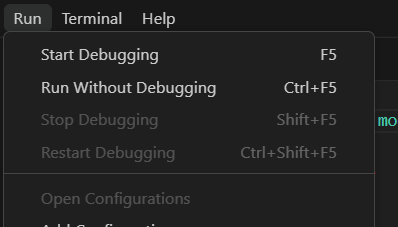
Now in the ‘Run’ menu choose ‘Start Debugging’ (or press F5):
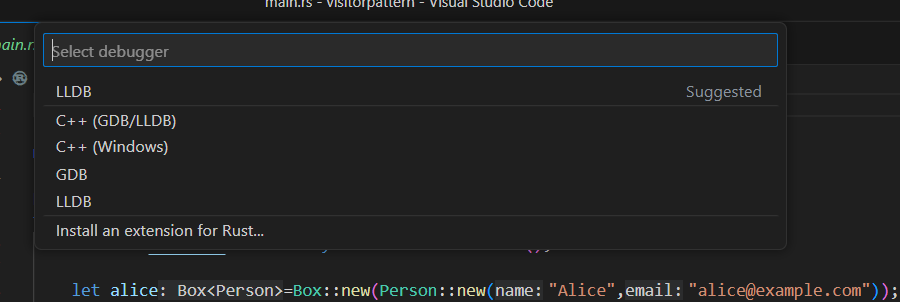
If you have not debugged your code before, it will ask you for the debugger, choose the upper LLDB debugger:
Because you have not debugged your code before, you get this error. Do not worry, just click OK:

VS Code now offers to generate the launch configurations for you, click ‘Yes’ here:

It now opens the ‘launch.json’ file:
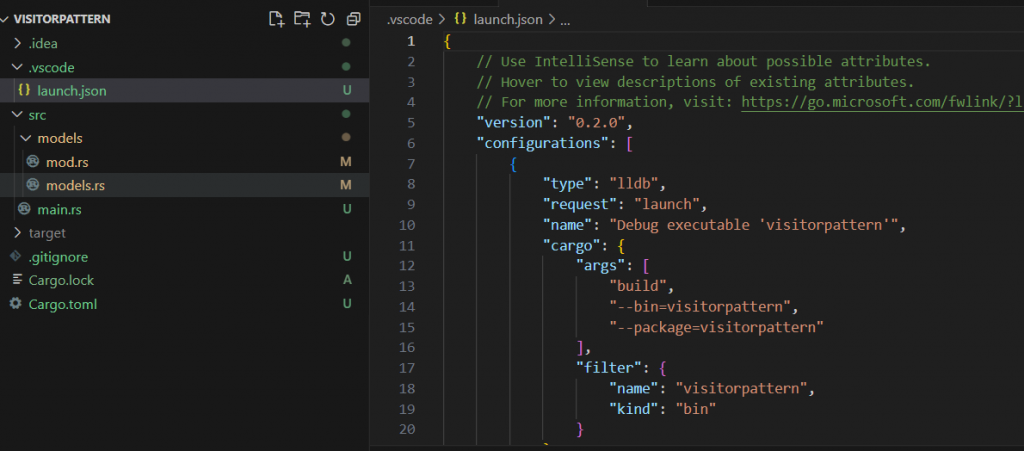
Now we can press F5 or choose ‘Start Debugging’ and after compiling, the program breaks on the first line:
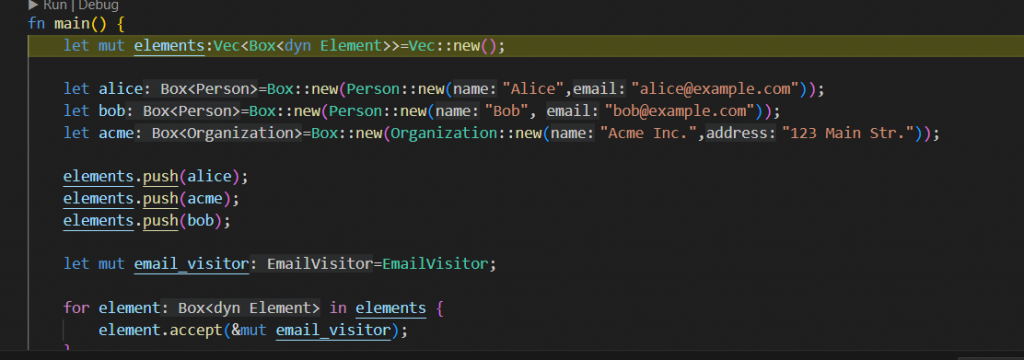
In the upper right hand corner you will find this handy debug panel. From left to right the icons mean:
- Continue
- Step over
- Step into
- Step out
- Restart
- Stop debugging

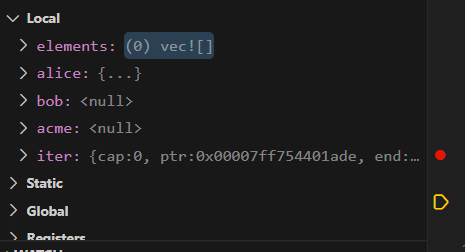
Once we step over the first line, we can see the local variables. The elements array is initialized to zero elements. I am not sure why the alice variable is not null:
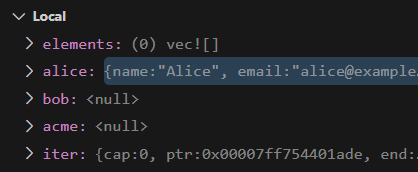
After stepping over the initialization of the alice variable, we see that it is correctly initialized:
After initializing all three variables and pushing them onto the vector, we see something strange when we open the vector. This is because the Vector contains structs which implement a certain trait, not concrete structs themselves. However, it would be handy if we still could see the reified, i.e. concrete struct which were pushed:

If we then go into the loop, we see more or less the same phenomenon:

Stepping into the accept method, it doesn’t get better:
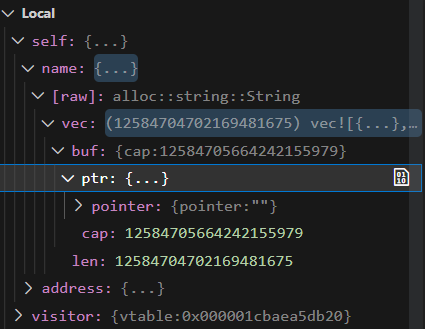
Strangely enough, once we’re in the accept method, things seem all right:

RustRover
On the whole you could say that the debugging experience in RustRover is a little bit smoother than it is in VS Code. Opening RustRover and you are presented with this screen:
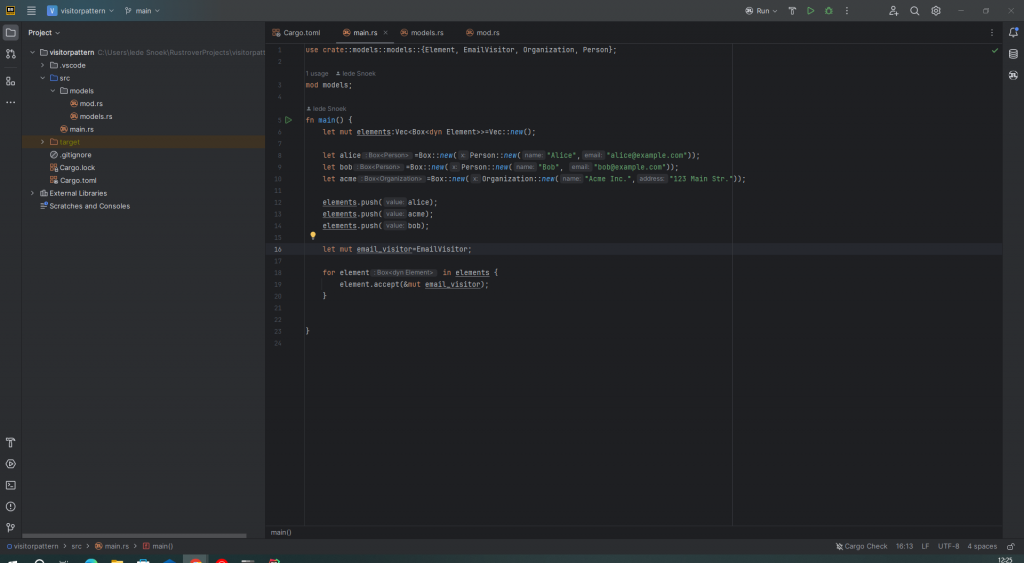
Setting a breakpoint is easy, just click on one of the line numbers.
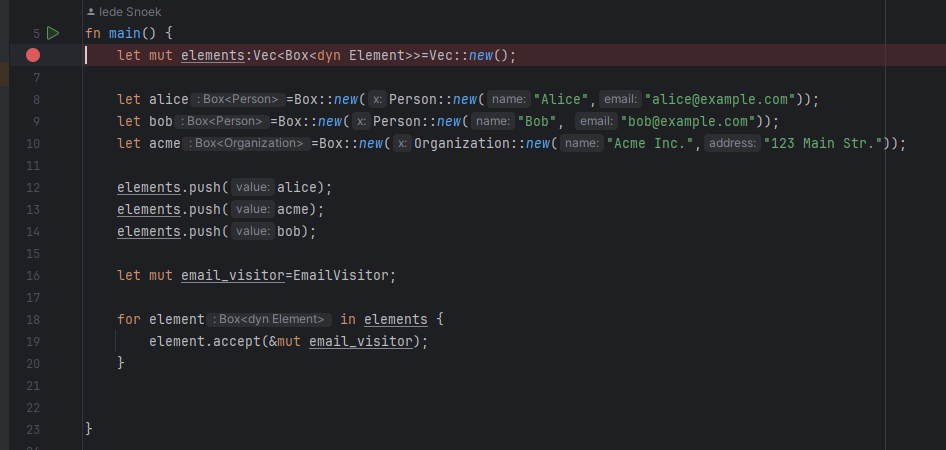
Click on the bug-symbol next to the arrow to start debugging. One of the advantages of RustRover is that you don’t have to have a special launch configuration, that is all taken care of for you.

After pressing that icon and rebuilding the app, the breakpoint is hit:
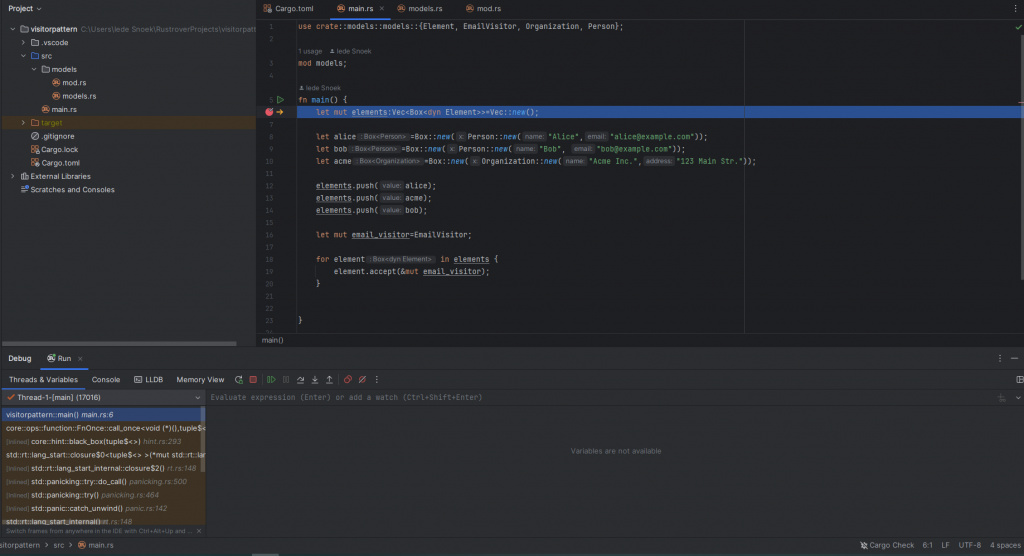
As you can see, the elements vector is correctly initialized:

The alice variable looks a bit strange, but after unfolding it, you can see the correct value:


After pushing all three variables, we see the vector has the correct size:

However, just as with VS COde we get the same problem: concrete structs are not shown, just the traits:

When stepping further through the code, the problem persists:

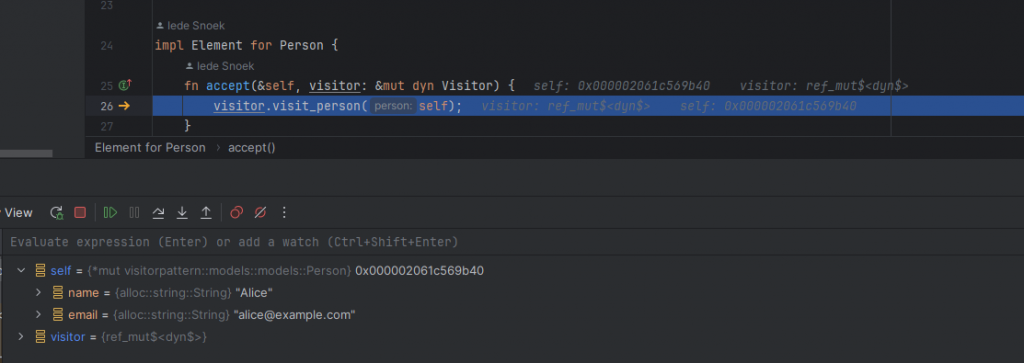
However, once we are inside a function, the variables becomes reified, i.e. the real type and value are shown:
Conclusion
Debugging in VS Code and RustRover is a good experience. When compared to other IDEs however, I must conclude that there is room for improvement, especially when it comes to showing trait types.
Furthermore the debugging experience in RustRover is a little smoother than in VS Code, but basically they offer the same experience I think.
As this is a very short review of the experience, and RustRover has been out somewhat over a week, things might change, as my experience with RustRover grows.
Let me conclude by saying that debugging either in VS Code or RustRover is a good experience with some rough edges which need to be smoothened out.


Thank you.